

Since 2007, the Taiwan Headquarters has conducted organizational greenhouse gas inventories in accordance with ISO 14064-1 standards and obtained third-party verification, gradually expanding the scope of the inventory each year as planned. By 2024, all of the Groupʼs global locations had been included in the inventory scope, with inventories and verification conducted in accordance with the GHG Protocol.
Through comprehensive inventorying, we have established emission data for each region and gained a clear understanding of the Groupʼs overall carbon emissions structure, serving as a crucial foundation for greenhouse gas management. Additionally, to fulfill our commitment to and the Science Based Targets initiative (SBTi), to ensure the integrity and credibility of the inventory results, we have engaged SGS
as a third-party verifier to conduct verification by 2025.
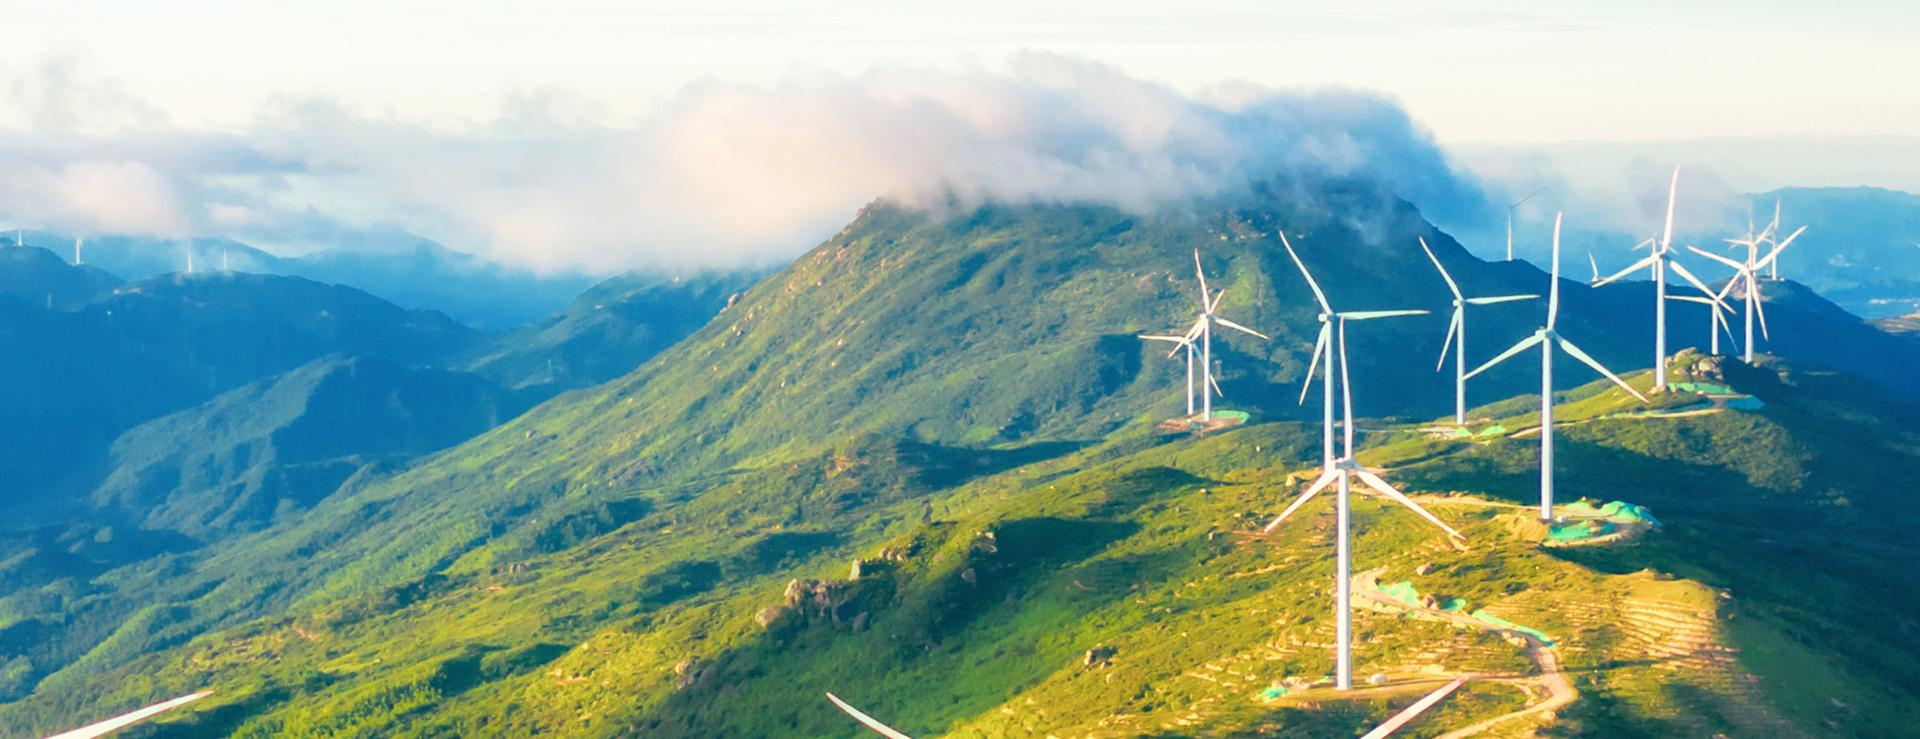
Creating Positive Environmental Impact
MERRY aims to achieve group-wide carbon neutrality by 2040 and RE100 (renewable energy) by 2030, advancing its sustainability strategies in line with the regulations announced by the Ministry of Environment.
Internally, MERRY has revised its environmental protection policies to strengthen its governance framework. Externally, it promotes green investment: NT$10 million in E. Sun Bank's sustainability bond (P14 E. Sun Bank 3; code: G102BK) in 2025, and, by the end of 2026, NT$20.48 million in a domestic innovative start-up (Taiwan Innovation Board – Foxtron Vehicle Technologies, code: 2258).
01
Advanced its RE100 target from 2040 to 2030
02
The Nearterm target was approved by the Science Based Targets initiative (SBTi)
03
Energy intensity increased by 9.73% compared with the 2023 base year.
04
Utilized 61.83% renewable energy, totaling 28,132 MWh.
05
Scope 1 and Scope 2 emissions intensity dropped 22.93% from the 2023.
06
Water intensity decreased by 12.72% compared to the 2023 baseline year.
Key Goals:2040 carbon neutrality
As a global leader in electroacoustic manufacturing,
Merry actively addresses the environmental and resource issues brought about by climate change.
Merry actively addresses the environmental and resource issues brought about by climate change.

GHG & Energy
Greenhouse Gas Inventory and Management
Greenhouse Gas Inventory (Scope 1 and 2; Categories 1 and 2)
In 2025, Scope 1 and Scope 2 emissions totaled 17,834.4985 t-CO2e, a decrease of 426.8854 t-CO2e(-2.34%) compared to the baseline year of 2023, which recorded 18,261.3838 t-CO2e. Regarding direct emissions reductions in Scope 1, production facilities(e.g., METC) have adopted “low-carbon business vehiclesˮ as a core initiative. For business-leased vehicles required for operations, they prioritize environmentally friendly models with energy-saving certifications and implement “green shuttle servicesˮ within the facility grounds, using electric vehicles (EVs) for business and shuttle services; Furthermore, in future vehicle replacement plans, electric vehicles will be prioritized to reduce direct greenhouse gas emissions from transportation at the source. For Scope 2 energy-saving measures and achievements, please refer to the “Energy Managementˮ section of this report. Additionally, greenhouse gas related to biomass emissions are zero (the entire Group does not use or burn biomass fuels).
Regarding fluorinated greenhouse gases, equipment containing refrigerants resulted in fugitive emissions of hydrofluorocarbons (HFCs). Total HFC emissions in 2025 were 219.8711 t-CO2e, accounting for 25.66% of Scope 1 emissions, compared to 365.7525 t-CO2e in the base year, a reduction of 145.8814 t-CO2e (-39.89%).
GHG Emission
GHG Emission Intensity
GHG Emissions by Category
| t-CO2e | 2022 | 2023 | 2024 | 2025 | |
|---|---|---|---|---|---|
| Scop 1 | Category 1 | 1,282.0583 | 1,591.6226 | 774.4565 | 856.9926 |
| Scop 2 | Category 2 | 19,972.4670 | 16,669.7612 | 17,683.2574 | 16,977.5059 |
| Scop 3 | Category 3~6 | 15,874.0996 | 121,473.1674 | 204,020.5976 | 504,110.2356 |
| Scop 1+2(Category1~2) | 21,254.5253 | 18,261.3838 | 18,457.7139 | 17,834.4985 | |
|
Scop 1+2+3(Category1~6) |
37,128.6249 | 139,734.551 | 222,478.312 | 521,944.7340 | |
| YEAR | 2022 | 2023 | 2024 | 2025 |
|---|---|---|---|---|
| Scope 1 | 0.0362 | 0.0434 | 0.0177 | 0.0184 |
| Scope 2 | 0.5642 | 0.4543 | 0.4032 | 0.3652 |
| Scope 3 | 0.4484 | 0.4004 | 4.6521 | 10.8432 |
|
Scope 1+2
|
0.6004 | 0.4977 | 0.4209 | 0.3836 |
| Scope 1+2+3 | 1.0489 | 0.8981 | 5.0730 | 11.2268 |
| Category (Unit: t-CO2e) | 2022 | 2023 | 2024 | 2025 |
|---|---|---|---|---|
| CO2 | 619.8470 | 789.5362 | 103.1317 | 84.8588 |
| CH4 | 596.1567 | 433.8732 | 450.0414 | 550.7081 |
| N2O | 2.1937 | 2.4608 | 2.5417 | 1.5545 |
| HFCs | 63.8610 | 365.7525 | 218.7414 | 219.8711 |
| PFCs | - | - | - | - |
| SF6 | - | - | - | - |
| Others | - | - | - | - |
Greenhouse Gas Inventory (Scope 3; Categories 3~6)
Since 2020, MERRY has conducted Scope 3 (Categories 3 to 6) greenhouse gas inventories in accordance with the ISO 14064-1:2018 standard. Beginning in 2024, inventories and verifications are carried out following the GHG Protocol, covering a total of 15 Scope 3 emission categories. The organizational boundary includes the entire group, and third-party verification has been completed by SGS. MERRY 's total emissions in 2025 amounted to 504,110.2356 t-CO2e. Aside from newly added inventory items, the primary cause of the increase is sales growth. Among them, emissions from Category 3-1 Purchased Goods and Services represent a relatively high proportion; future efforts will continue in collaboration with the supply chain to reduce carbon emissions.
| t-CO2e | 2023 | 2024 | 2025 | |
|---|---|---|---|---|
| Inventory Organizational Boundary |
2021-2022:Taiwan Headquarters, MECL, MEVN, METC 2023 added :MECA, MESG, MEST, ASCX, FUXM, MENA, MEMP 2024:The entire group
|
|||
| Scope 3-1 Product and services purchased | Category4 | 73,919.2697 | 117,388.5957 | 406,264.1091 |
| Scope 3-2 Capital products | Category4 | 5,228.7818 | 9,722.7912 | 21,265.2845 |
| Scope 3-3 Activities related to fuels and energy not under Scope 1 or 2 | Category4 | 3,920.9167 | 3,653.6426 | 1,933.6285 |
| Scope 3-4 Upstream transportation and delivery | Category3 | 9.9907 | 39,954.9963 | 40,202.4280 |
| cope 3-5 Wastes generated from operations | Category4 | 170.0350 | 243.5618 | 280.9451 |
| Scope 3-6 Business trips | Category3 | 297.5593 | 368.3834 | 426.4751 |
| Scope 3-7 Employee commutation | Category3 | 4,687.6802 | 2,686.8552 | 9,912.0380 |
| Scope 3-8 Upstream lease assets | Category4 | 0 | - | - |
| Scope 3-9 Downstream transportation and delivery | Category3 | 24,655.1480 | 3.1063 | - |
| Scope 3-10 Processing of Sold Products | Category5 | 0 | 395.0093 | - |
| Scope 3-11 Use of Sold Products | Category5 | 3,879.8455 | 15,148.5695 | 11,618.8065 |
| Scope 3-12 End-of-Life Treatment of Sold Products | Category5 | 3,530.3116 | 12,920.6032 | 10,847.5326 |
| Scope 3-13 Downstream Leased Assets | Category5 | 0 | 155.7425 | 243.8327 |
| Scope 3-14 Franchises | Category5 | 0 | - | - |
| Scope 3-15 Investments | Category5 | 1,173.6289 | 1,378.7408 | 1,115.1555 |
| Scope 3; Total Emissions of Categories 3 to 6 | 121,473.1674 | 204,020.5976 | 504,110.2356 | |
Energy management
Since 2016, the Taiwan headquarters has implemented the ISO 50001 Energy Management System, subsequently expanding to MECL and MEVN, continuously obtaining certifications to systematically execute various energy-saving and carbon reduction measures, as well as upgrading energy-efficient equipment. In recent years, a phased establishment of the energy management system has been developed, utilizing digital systems to automatically collect data and proactively monitor energy consumption, thereby improving energy-saving effectiveness annually.
Total Energy Consumption
Energy Consumption Intensity
Non-Renewable Fuel Consumption
Total Electricity Consumption (Including Renewable Energy)
,
| Unit:GJ | 2022 | 2023 | 2024 | 2025 |
|---|---|---|---|---|
| Total Non-Renewable Electricity Consumption | 104,192.77 | 91,245.20 | 61,868.37 | 59,040.00 |
| Total Renewable Electricity Consumption | 10,951.08 | 19,731.89 | 45,121.43 | 95,271.16 |
|
Total Energy Consumption |
115,143.85 | 110,977.09 | 106,989.8 | 154,311.16 |
| Unit:GJ | 2022 | 2023 | 2024 | 2025 |
|---|---|---|---|---|
| Total Energy Consumption Intensity | 3.2528 | 3.0247 | 2.4396 | 3.3192 |
| Unit:GJ | 2022 | 2023 | 2024 | 2025 |
|---|---|---|---|---|
| LNG | 10,387.22 | 13,223.18 | 406.00 | 381.26 |
| LPG | 41.53 | 47.75 | 239.90 | 315.55 |
| Automotive gasoline | 934.56 | 938.90 | 804.95 | 527.47 |
| Diesel Fuel | 213.10 | 173.50 | 164.78 | 106.84 |
| Unit:GJ | 2022 | 2023 | 2024 | 2025 |
|---|---|---|---|---|
| Total Non-Renewable Electricity Consumption | 25,727 | 21,350 | 16,737 | 16,030 |
| Total Renewable Electricity Consumption | 3,042 | 5,481 | 12,533 | 26,464 |
|
Total Electricity Consumption |
28,769 | 26,831 | 29,270 | 42,494 |
2025Energy-Saving Improvement Measures○New Energy-Saving Items for 2025
Taiwan HQ
- Use of spiral variable frequency chilled water units to enhance energy use efficiency
- Use independent electricity meters on each floor to monitor electricity consumption in office areas and implement improvements for abnormal usage.
MECL
- Implementing waste heat recovery from
air compressors at branch plants to heat
water for dormitories - Installing smart control systems on air
compressors at branch plants to activate
operation based on air demand, thereby
achieving energy savings
- Adjust the hot pump water storage
volume based on dormitory occupancy to
reduce per capita electricity consumption. - Manage air conditioning by setting temperature
controls for production lines and
office areas, and reducing the number of
air conditioners in warehouses. - The production workshop also turns off
ceiling coil units at scheduled times daily.
MEVN
- Gradually replace motors with higher energy
efficiency ratings, with an estimated
annual electricity savings of approximately
78,398 kWh - Smart conference rooms have been
established, with power activated via card
swipe to prevent standby power consumption
and unnecessary lighting, resulting in
an estimated annual electricity savings of
approximately 5,000 kWh - Replace lighting with high-efficiency LED
energy-saving tubes floor by floor - Continue to promote the retrofitting of
dryers with zero-air-consumption models;
after improvements, annual electricity
savings are 227,886 kWh
- The laboratory chiller is integrated into the
air conditioning system to collaboratively
achieve effective cooling, thereby avoiding
the energy consumption associated with
independent operation. This results in an
annual electricity saving of approximately
65,010 kWh.
METC
- Continuing existing equipment management
and maintenance to ensure sustained
operational efficiency - Six new inverters have been added to the air conditioning system. By adjusting the compressorʼs operating speed, wear
caused by frequent start-stop cycles is
reduced, achieving an annual electricity
saving of approximately 223,923 kWh. - Outdoor areas have fully adopted solar-
powered lighting equipment, with an
estimated annual electricity savings of
9,056 kWh.
MSCS
- Allocate the use of energy-consuming
equipment according to production capacity
planning to achieve minimum energy
consumption
- Switched to LED lighting fixtures and
modified wiring to add power switches, enabling electricity use according to regional
demand. - Explicitly established air conditioning usage
regulations, with scheduled power on/off to conserve energy.
ASCX
- Implement elevator usage controls to
prevent unnecessary operation, thereby
effectively conserving energy
- Discontinued the 24-hour continuous operation
of equipment such as agar wax ovens to save electricity. - Adjusted three-phase current balance to
reduce energy loss and improve system
stability, achieving annual electricity savings of approximately 10,560 kWh.
Use of Renewable Electricity
In 2025, within the scope of the RE100 commitment, a total of 28,132 MWh of renewable electricity was used, accounting of total electricity consumption for 61.83%. Of this, 12,990 MWh came from direct use of renewable energy, representing an increase of 180.93% compared to the 4,624 MWh of directly supplied renewable electricity in 2024; the remaining 15,142 MWh was sourced through the purchase of renewable energy certificates. MERRY will continue to plan and expand its sources of renewable energy. Through diversified energy procurement and the construction of its own facilities, the company will gradually fulfill its RE100 commitment, taking concrete actions to steadily advance the energy transition and demonstrate its long-term commitment to sustainable development.
| 2022 | 2023 | 2024 | 2025 | |
|---|---|---|---|---|
| % of Renewable Energy Certificates | 83.53% | 68.28% | 66.96% | 53.83% |
| % of Actual Renewable Energy Usage | 16.47% | 31.72% | 33.04% | 46.17% |